How to see the budget position for the whole organisation
Budget vs Actuals
You can use these reports to see how much you've spent from your budgets and how much remains, so you can check if you're under or over budget.
Budget vs Actuals (Excel report)
Note: This report is available if you subscribe to Sage 200 Services Extra.
Use the Budget vs Actuals Excel report to compare your nominal account budget figures against your actual and committed expenditure, and view figures for selected periods or an annual budget.
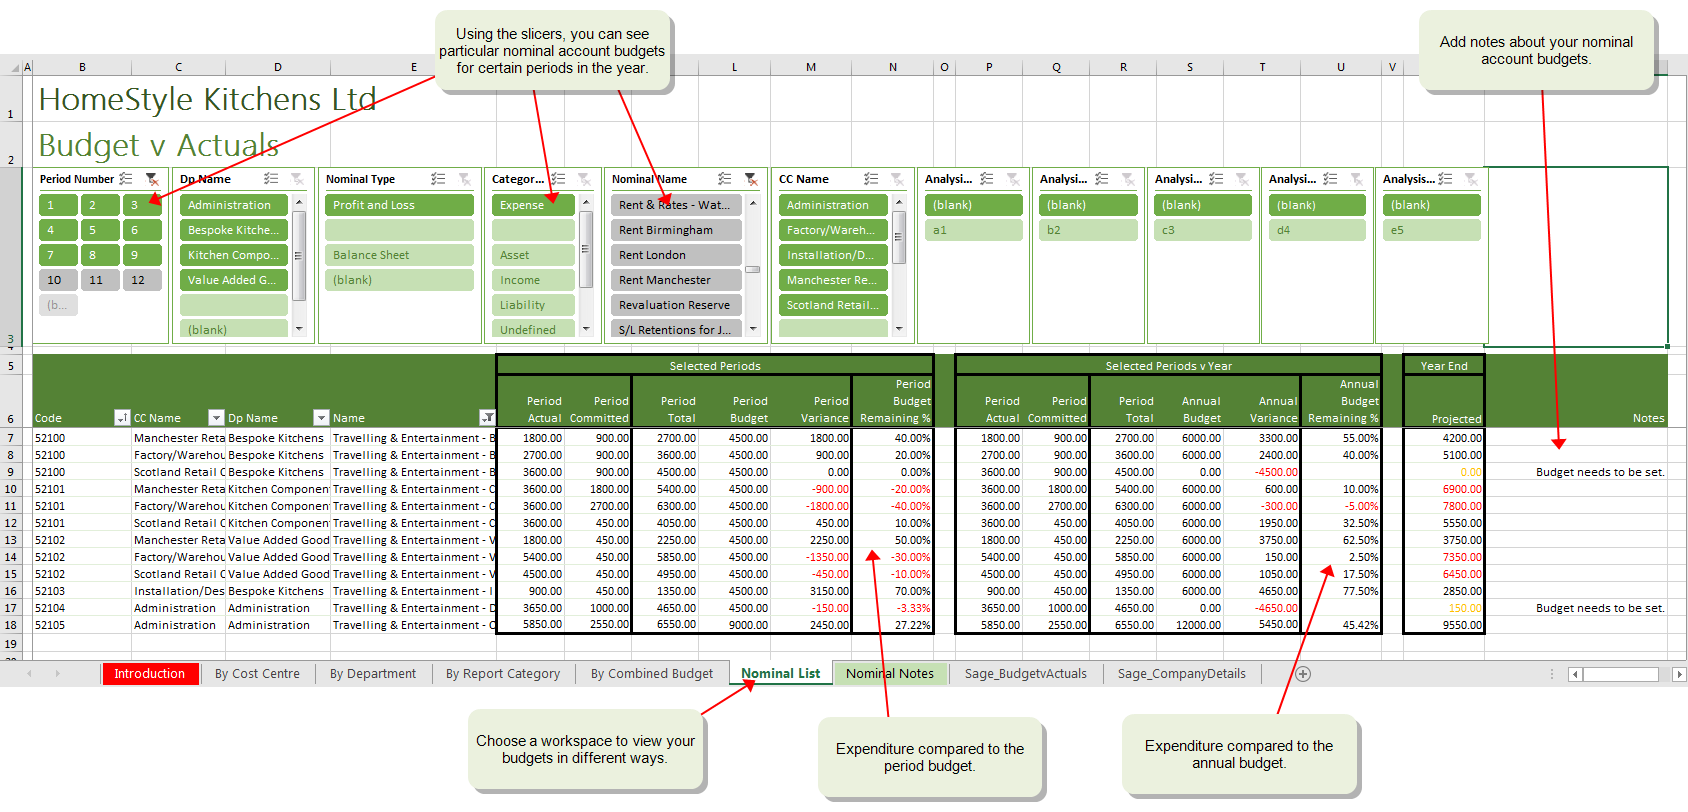
- Select a worksheet to show your budget information by cost centre, department, report category, combined nominal budget, or by nominal account code.
- Use the slicers to focus on nominal account budgets that you want to see. For example, you can select particular periods in the year, and choose accounts by cost centre and department, the nominal account type or category, or by analysis code.
Open: Excel reporting > Excel reports
- Select the Budget vs Actuals row and click Update. This updates the workbook with the latest information from Sage 200.
-
Click View to open the report in Excel.
- Select the required worksheet.
Budget v Actuals (standard reports)
You can use the Budget v Actuals reports to compare your budget and actual figures, and see these grouped by cost centre, department, or the type of nominal account.
-
Nominal Ledger > Reports > Budget Comparisons >
- Budget v Actuals By Cost Centre, to group by cost centre.
- Budget v Actuals By Cost Department, to group by department.
- Budget v Actuals By Nominal Type, to group by nominal account type (expense, income, asset, liability).
-
Use the criteria to choose the information to include in the report, such as the period (date), nominal accounts, cost centre, or department.
Nominal budget overview
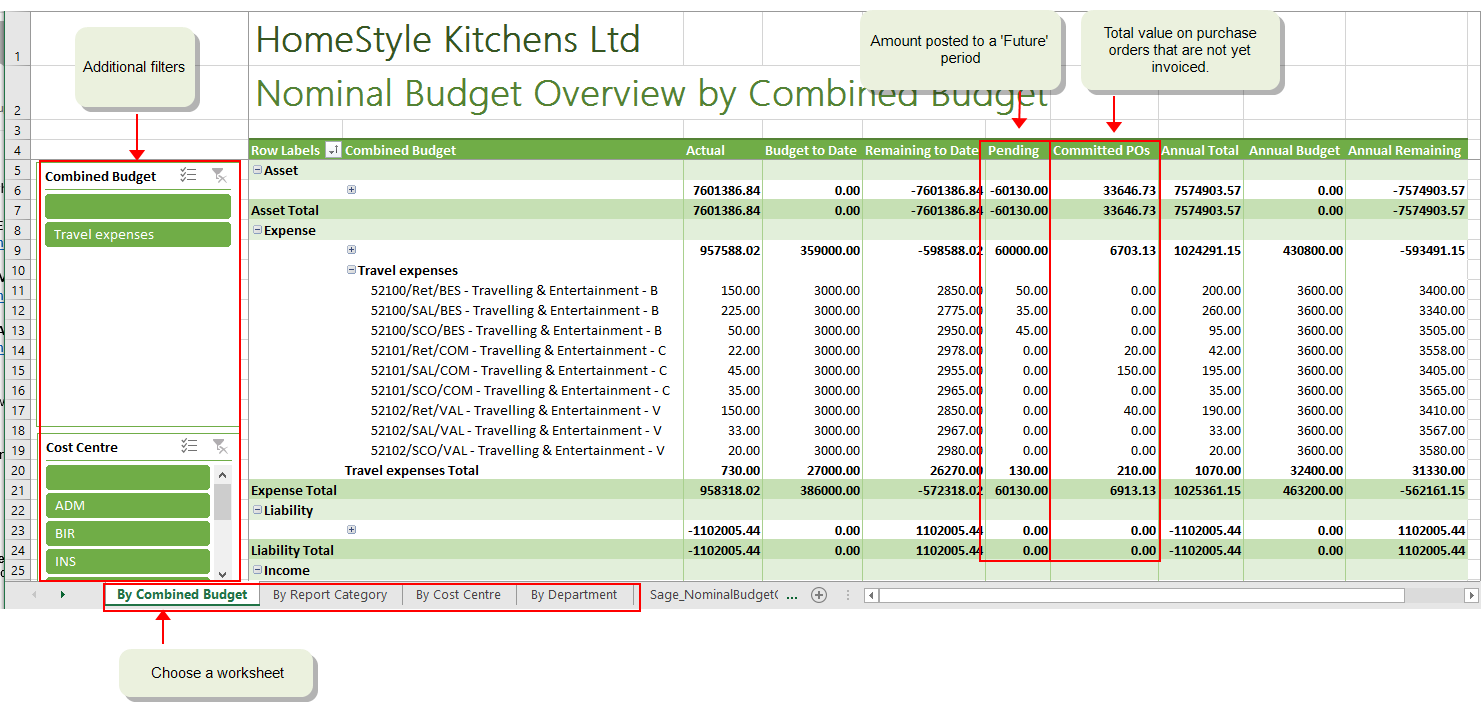
The Nominal Budget Overview Excel workbook includes budget, actual and committed values for all your nominal accounts.
Information is shown across several worksheets (Report Category, Cost Centre, Department and Combined Budget). You can use all the usual functions of Excel to manipulate the data as required.
Each worksheet has sets of filters so you can easily break down the information in different ways, such as:
-
See your total budget for all income and expense accounts.
- See how much of their budgets your department heads have spent and what on.
-
Compare one department's budget against another.
Use the department worksheet and just select the relevant departments from the left side.
-
See what's you've spent on specific categories such as office stationery, staffing costs, or company vehicles.
Use the Report Category worksheet and select the relevant report categories from the filters on the left side.
-
See your income and expenditure per cost centre.
-
Compare spending for a range of cost centres.
Use the Cost Centre worksheet and select the cost centres you want to compare from the filters on the left side.
Open: Excel reporting > Excel reports
-
Select the Nominal Budget Overview row and click Update. This updates the workbook with the latest information from Sage 200.
Note: If you can't see this report in the list, restore the report using the Restore default Excel reports screen.
-
Click View to open the report in Excel.
- Select the required worksheet.
-
You can use the filters in the left pane to show and hide accounts as required.
As many of the Excel reports show all your key financial data, you may want to control who has access to them.
You can choose which reports users have access to via the user's role in System Administration.
You can add information that is not currently shown on the report. For example, you might want to calculate the amount remaining as a percentage of the budget.
To calculate the percentage remaining of the budget to date by department:
- Select the By Department worksheet.
- Select the total row for the department you want to calculate.
- Enter the beginning of the following formula for the row: =100/
- Select the Budget to date value for the row.
- Enter *.
- Select the Actual value for the row.
- Press Return.
Depending on the worksheet and the row selected, the formula for the row should be similar to:
=100/GETPIVOTDATA("Budget to Date",$B$4,"Department","ART","Report Category Type","Expense")*GETPIVOTDATA("Actual",$B$4,"Department","ART","Report Category Type","Expense")
You can add information that is not currently shown on the report. For example, you might want to calculate the amount spent as a percentage of the budget.
To calculate the percentage spent of the budget to date by department:
- Select the By Department worksheet.
- Select the total row for the department you want to calculate.
- Enter the beginning of the following formula for the row: =100 -(100/
- Select the Budget to date value for the row.
- Enter *.
- Select the Actual value for the row.
- Add the closing bracket ).
- Press Return.
Depending on the worksheet and row, the formula should be similar to: =100-(100/GETPIVOTDATA("Budget to Date",$B$4,"Department","ART","Report Category Type","Expense")*GETPIVOTDATA("Actual",$B$4,"Department","ART","Report Category Type","Expense")
The Pending column includes waiting postings and deferred transactions (the value of transactions that have been posted in Future period).
To date
This is the total period budget (up the current period) minus the total actual value (up to the current period). This doesn't include deferred, pending or committed values.
For example, you have a budget of £100 per month (period). You're currently in month six of your financial year, so your budget to date is £600. Your actual spend up to the end of month 6 is £400, so the amount remaining is £200 (600- 400).
Annual
This shows the annual budget minus the actual, pending, deferred and committed values.
For example, you have a budget of £100 per month (period), so your annual budget is £1200. You've spent £400 so far this year but you have also entered a purchase invoice dated in month 7 for £50 and have ordered £300 of stationery that you're still waiting for. The Annual remaining amount is £450: 1200 - 750 (400 (actual) + 50 (pending) + 300 (committed).
Yes - the Excel reports work exactly the same as any other excel workbook.
You can add text to any unused cell or append a comment from the Review tab in the usual way.
Don't forget, if you want to keep the changes you've made or create several new reports from the default one, save the report with a new name. Once saved you can upload your custom versions as new reports
See Using Excel Reports.
How budget holders can see their budgets
Budget holders can see their budgets as a real time summary view where they are the budget owner or as a printed report that you distribute.
For a real time summary view, budget owners can use the My Budget Overview workspace.
As this is a workspace, the budget owner can be a web user. This allows them to access the workspace via a browser. This is more cost effective than having all budget holders as full Sage 200 users.
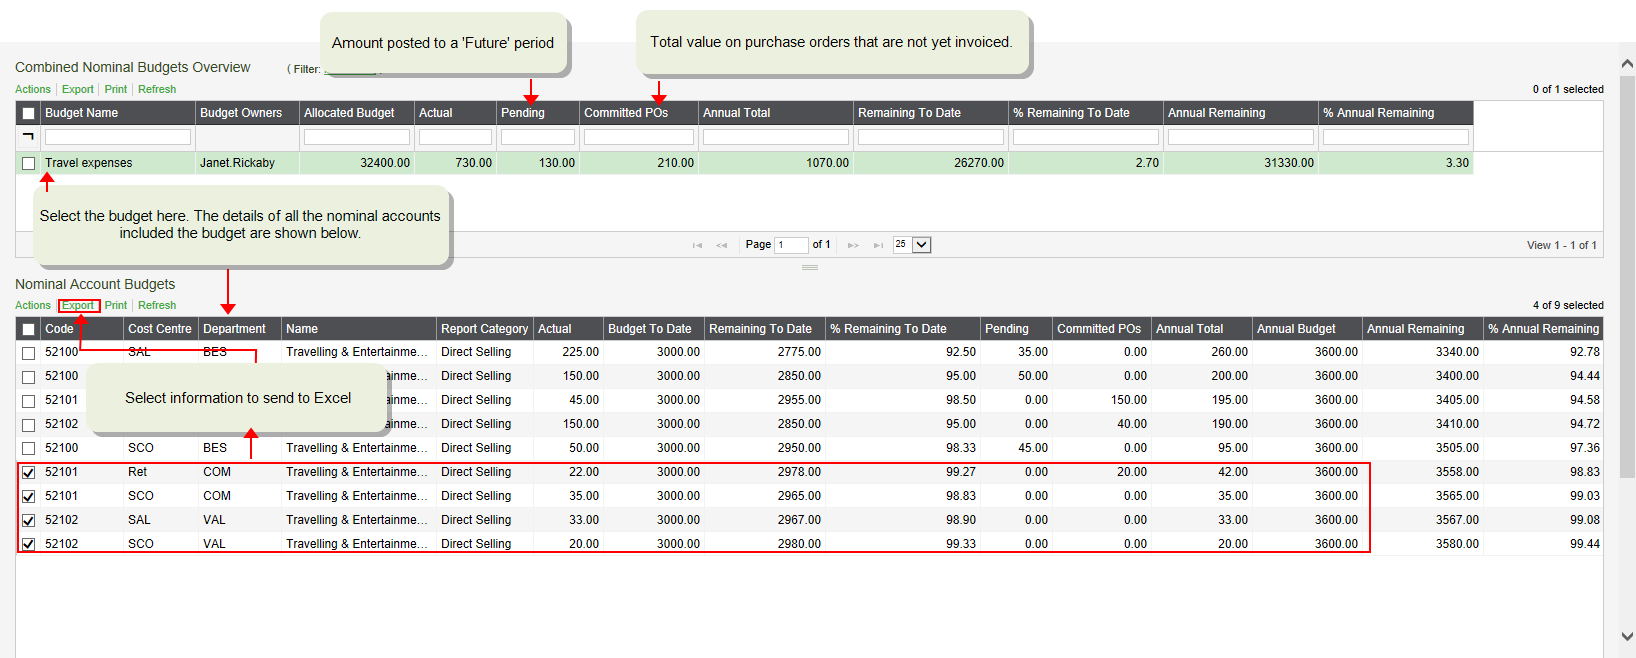
As long as you've set up a combined nominal budget and set a Budget Owner, a budget holder can see the total actual and committed amount spent for all the nominal accounts that make up their budget. For example, if your budget holders are your Heads of Department, create a combined nominal budget includes all the nominal accounts with the same Dept.
Open: Nominal Ledger > Budgets > My Budgets Overview
-
If you're the budget owner for more than one budget, select the budget in the top section.
This section shows the rolled up totals for all nominal accounts that make up the combined budget.
- The bottom section shows a breakdown of the budget vs the actual balance by nominal account.
- You can add or remove any columns. Just right-click on a column heading and choose the appropriate option. The column selector shows all available column and allows you to re-order them.
- To send the data Excel, click Export above the appropriate list.
- They are updated in real time so a budget holder can always see the most up to date information.
- Saves money as you can buy web user licenses so budget owners only need to access the workspaces from the Self Service web app.
- Saves time for other users as they don't have to print and distribute reports to budget holders.
- Workspaces can be customised by each budget holder to show the information they want to see.
- Information can be exported to an Excel spreadsheet for further customisation and manipulation.
- As the Self Service web app can be accessed from any device with a compatible browser, budget holders can access information when they're not sat at their desks.
- If you're also using purchase requisitions, budget holders can also authorise requisitions entered against their budgets using the Self Service web app.
Report on budgets by department
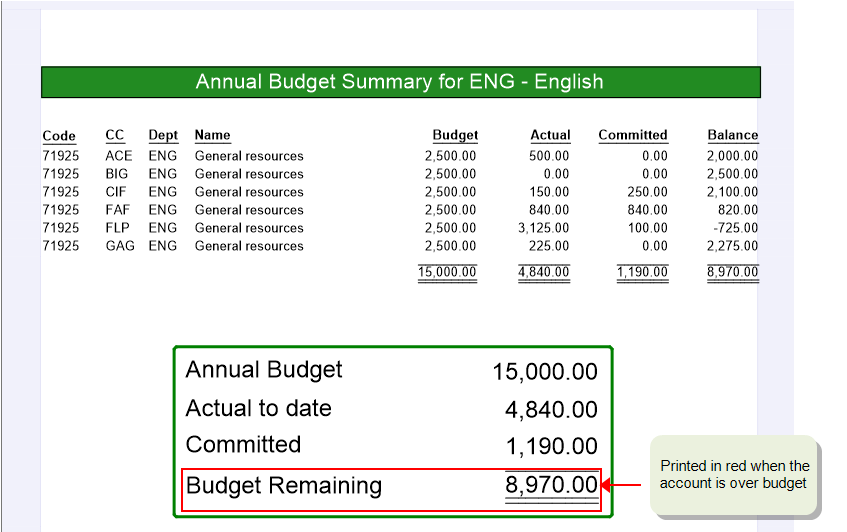
This Budget Statement by Department report shows the budget, actual, committed and difference (Balance) for all nominal accounts with the same department. The report is broken down into sections per department so the report can easily be separated and distributed to different department heads via email. It contains:
-
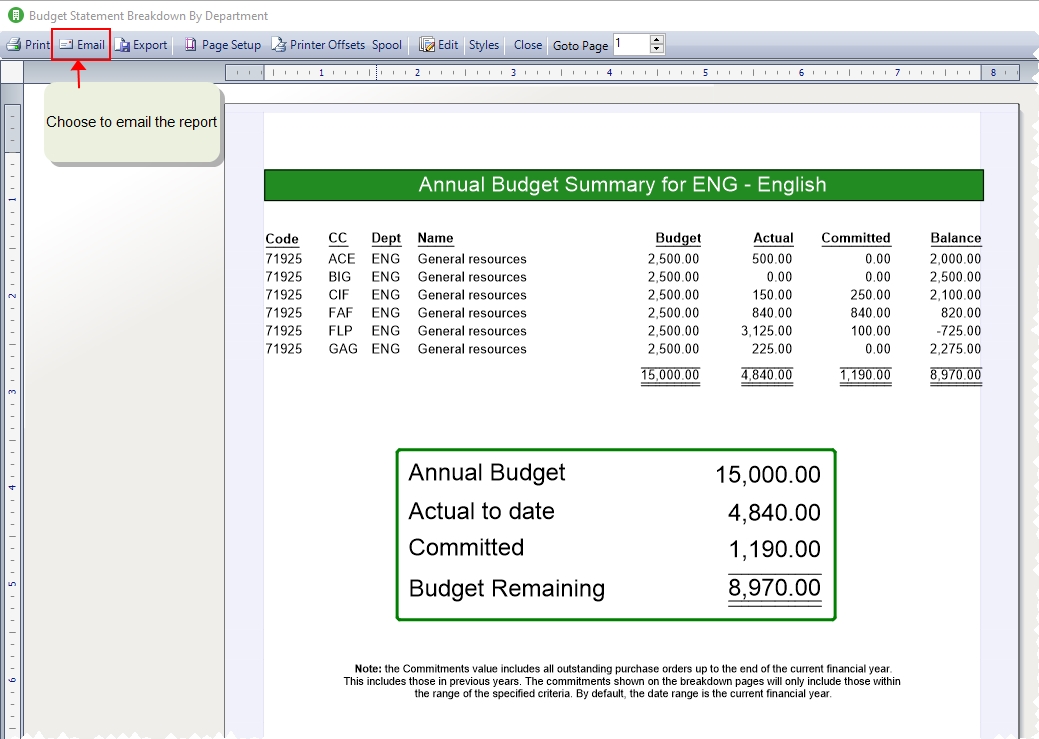
A summary page per department so department heads can see at a glance spending against their budget.
This shows the actual and committed values by department for your current financial year only.
- The budget remaining is shown in red to indicate when you're over budget.
-
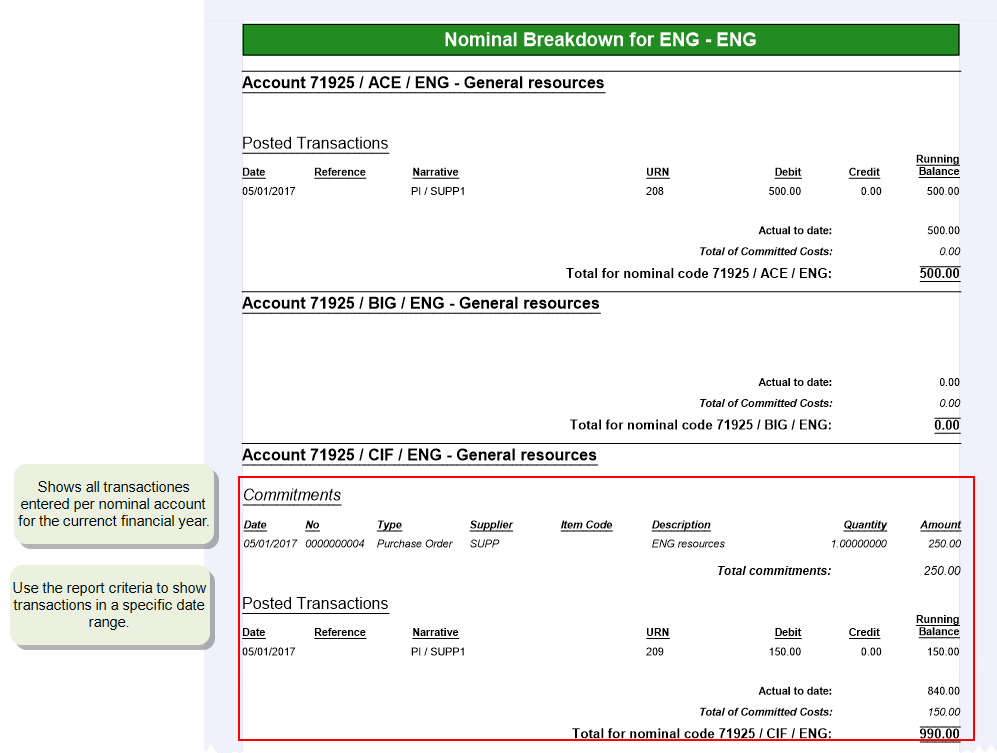
A section showing the details of all transactions, both actual and committed, per department, so department heads can see what the budget has been spent on.
This shows all transactions, actual and committed, entered for each nominal account within the department, using the date range specified on the criteria.
- It only includes Income and Expense accounts (balance sheet accounts are automatically excluded).
Open: Nominal Ledger > Reports > Budget Comparisons > Budget Statement Breakdown By Department.
-
Choose the required department(s) from the Department drop-down list
If you choose All, any accounts without a department are grouped together at the beginning of the report. To exclude these:
- Choose In from the Department drop-down.
- Select the departments that you want to include.
- Don't select checkbox with no label.
- If you're just looking to report on a single nominal account or range of accounts, use the Account drop-down to select the desired accounts. This just affects the breakdown sections of the report.
-
Choose the periods to run the report for.
- The summary page always shows annual values.
- If you choose a date range, this just affects the transactions shown in the breakdown section. You might want to change this if you trying to trace what you've spent in a particular period.
- By default the date range is set to your current financial year.
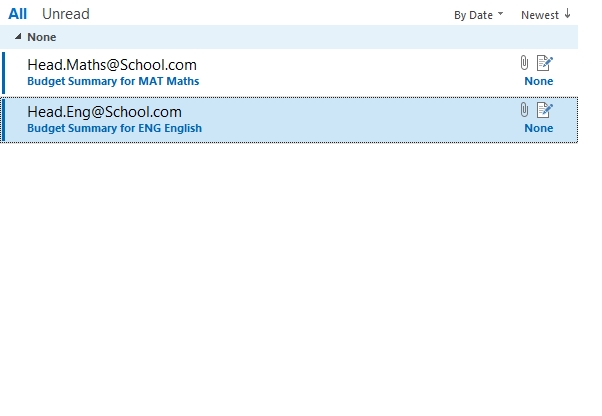
The report is configured so that the each department section is attached to a separate email. If you have 10 departments then the relevant section of the report is attached to 10 separate email messages, which are sent to your out-box.
You can send each section of the report to a different recipient such as the head of department.
-
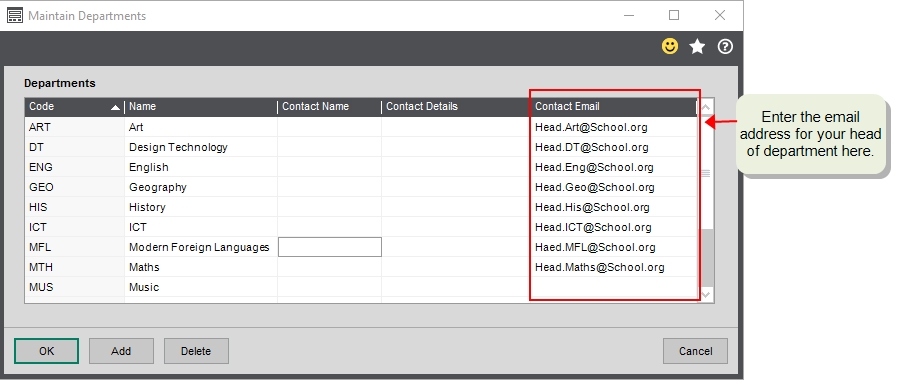
To always send the report to your department heads, you can set the email address for each head of department on the Departments screen (Settings > Cash Book / Nominal > Departments).
If you're going to email to different recipients each time, leave out this step. When you email the report, each section will be sent on a separate email to your out-box. You then enter the appropriate email address as required.
-
When printing the report make sure Sage 200 is set to Preview or Spooler.
Open:
 Tools > Choose Output Mode.
 -
View the report on screen or select it from the spooler list and click Email. Each section is attached to a different email. The To address will either contain the address specified for the department or be blank for you to complete.
The summary sections always show the totals for your current financial year. The breakdown sections show transactions and purchase orders for the date range specified in the criteria. If you've set the date range to anything other than your current financial year, there will be a difference.
Note: The summary also includes any outstanding purchase orders from a previous year in the total commitments value.
Report on budgets by cost centre
This Budget Statement by Cost Centre report shows the budget, actual, committed and difference (Balance) for all nominal accounts with the same cost centre. The report is broken down into sections per cost centre so the report can easily be separated and sent to different people. It contains:
-
A summary page per cost centre so you can see at a glance spending against budget.
This shows the actual and committed values for your current financial year.
- The budget remaining is shown in red to indicate when you're over budget.
-
A section showing the details of all transactions, both actual and committed, per cost centre, so you can see what the budget has been spent on.
This shows all transactions, actual and committed, using the date range specified on the criteria.
- It only includes Income and Expense accounts (balance sheet accounts are automatically excluded).
Open: Nominal Ledger > Reports > Budget Comparisons > Budget Statement Breakdown By Cost Centre.
-
Choose the required cost centre(s) from the Cost Centre drop-down list.
If you choose All, any accounts without a cost centre are grouped together at the beginning of the report. To exclude these:
- Choose In from the Cost Centre drop-down.
- Select the cost centres that you want to include.
- Don't select the checkbox with no label.
- If you're just looking to report on a single nominal account or a different range of accounts, use the Account drop-down to select the desired accounts. This just affects the breakdown sections of the report.
-
Choose the periods to run the report for.
- The summary page always shows annual values.
- If you choose a date range, this just affects the transactions shown in the breakdown section. You might want to change this if you trying to trace what you've spent in a particular period.
- By default the date range is set to your current financial year.
The report is configured so that the each cost centre section is attached to a separate email. If you have 10 cost centres then the relevant section of the report is attached to 10 separate email messages, which are sent to your out-box.
You can then send each section of the report to a different recipient such as a senior manager.
-
If you always want to send each section of the report to the same person, set the email address on the Cost Centres screen (Settings > Cash Book / Nominal > Cost Centres).
If you're going to email to different recipients each time, leave out this step. When you email the report, each section will be attached to a separate email in your out-box. You then enter the appropriate email address as required.
-
When printing the report make sure Sage 200 is set to Preview or Spooler.
Open:
Tools > Choose Output Mode. -
View the report on screen or select it from the spooler list and click Email. Each section is attached to a different email. The To address will either contain the email address specified for the cost centre or be blank for you to complete.
View period budgets for all accounts
Period Budgets report
Use the Period Budgets report to check the budget figures per period that you have set for your nominal accounts. For example, you might want to compare past, current and future budget figures for a selection of nominal accounts.
Open: Nominal Ledger > Reports > Budget Comparisons > Period Budgets.
Other ways to view budgets
Excel reports
Open: Excel Reporting > Excel reports
Use the Nominal commitments report.
This shows all the purchase order lines entered against each nominal account. You can also use this to see how whether any part of an order has been received or invoiced.
Use the Nominal Budgets report.
This shows the budget, actual and committed value per period, per nominal account.
You can use the filters to see this for a single period, by cost centre and department.
Printed reports
Open: Nominal Ledger > Reports > Financial Statements
-
Profit and Loss (MTD-YTD Budgets)
This adds a budget column to the standard P & L report.
-
Profit and Loss (MTD-YTD Budgets) by Cost Centre
This adds a budget column to the standard P & L report.
Open: Nominal Ledger > Reports > Budgets
- Summary budgets
- Summary budgets by number
- Detailed budgets
- Detailed budgets by number
Workspaces and enquiries
Open: Nominal Ledger > Budgets Combined Nominal Budgets
Open: Nominal Ledger > Nominal Enquiries > Nominal Account Enquiry
If you add the Annual budget column to the workspace, you can also see the budgets for all nominal accounts at a glance.
- Right-click a column heading and choose whether to add the column to the right or left.
-
Choose Annual budget.