Using Excel Reports
Watch a video
View Excel reports
Open: Excel Reporting > Excel Reports
-
To open a report in Excel, select it and click View.
-
To update the information in a report, select it and click Update.
Using tables in Excel
The reports provided display information in an Excel "pivot table". To find out what you can do with pivot tables in Microsoft Excel, there are a number of online resources.
Visit the Microsoft Support website (opens in a new tab), and in the support area search for Excel topics about "PivotTable".
Try searching YouTube (opens in a new tab) for tutorials about using pivot tables.
Filter and sort data
You can filter and sort the information displayed in the report.
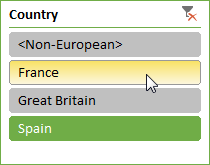
Filter data using a slicer
Use slicers to select what information to display.
-
To select more than one filter, press Ctrl and click the filters.
-
To deselect all filters from a slicer, click
 Clear filter.
For example, using a slicer we can choose to display accounts for specific countries.
Filter and sort data manually
If a column or row heading includes an  arrow button, click the button to display options for filtering and sorting the data.
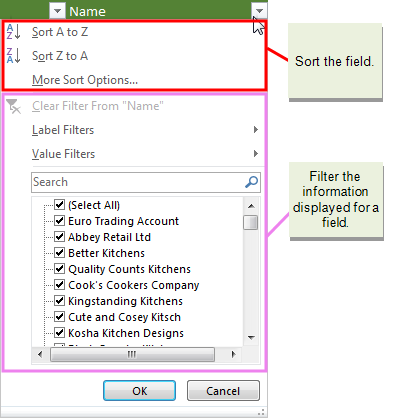
- Use the Sort options to change the order in which the information is listed.
- You can manually pick which items to display or hide from the list.
- You can filter the information based on whether it begins, ends or contains certain text. For example, to filter account names that begin with the letter N, select Label Filters > Begins With and enter N*.
Change how fields are displayed
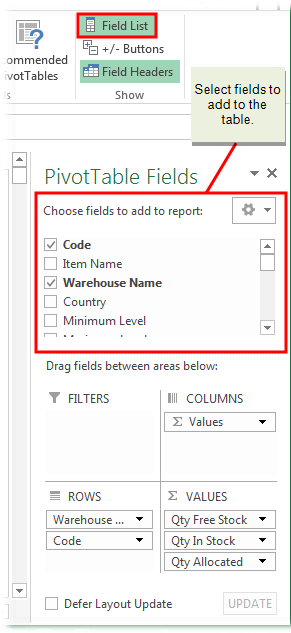
To select which fields are displayed or hidden in the report, use the Pivot Table Fields list.
To display the field list in Excel, either:
-
Right-click anywhere inside the table and select Show Field List.
-
Select anywhere inside the table to display the PivotTable Tools ribbon, then on the Analyze (or Options) tab select (Show >) Field List.
Add or remove a field
-
Use the field section to pick the fields you want to show or hide in your table.
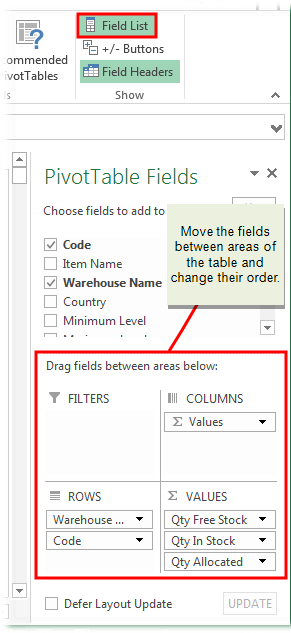
Rearrange fields
Use the areas section to arrange the fields the way that you want. You can drag fields between the four areas, or change the order of fields in an area.
-
Use Filters to add the field as a filter for the whole table.
-
Use Columns to add the field as a column label.
-
Use Rows to add the field as a row label.
In the supplied financial statements, the rows will be in a hierarchy, with the nominal accounts (CategoryLabel) organised into groups.
-
Use Values to add the field as numeric data in the table. You can also choose how to display totals for the value, e.g. Sum will show a total of the values added together, or Count will count the number of items.
Add a logo or information to the report
You can add your own company logo or information to a report, just place them anywhere outside of the pivot table.