There are a number of ways in which you can view, manipulate and extract information from Sage 200. As well as printed reports, Sage 200 offers other features which can all be used to sort, filter and find information. You can use:
- Reports
- Enquiry screens
- Workspaces
- Summaries
- Lists
- Excel reporting
This is the most common way to extract information about your business. We have supplied a set of default reports you can use to review many aspects of your business. These are installed by default and can be accessed from the Reports  icon at the top of lists, from the Reports section of the relevant section of the menu and from workspaces.
Additional reports
We have additionally created alternative reports, based on your feedback, which you can choose to use. If you've migrated from Sage 50 Accounts, some of these additional reports may suit your business better or be more familiar. These can be used instead of or in addition to the default reports.
To use these you need to:
- Download and save the reports to your local PC.
- Add the reports to installation of Sage 200 using the Custom Report Manager.
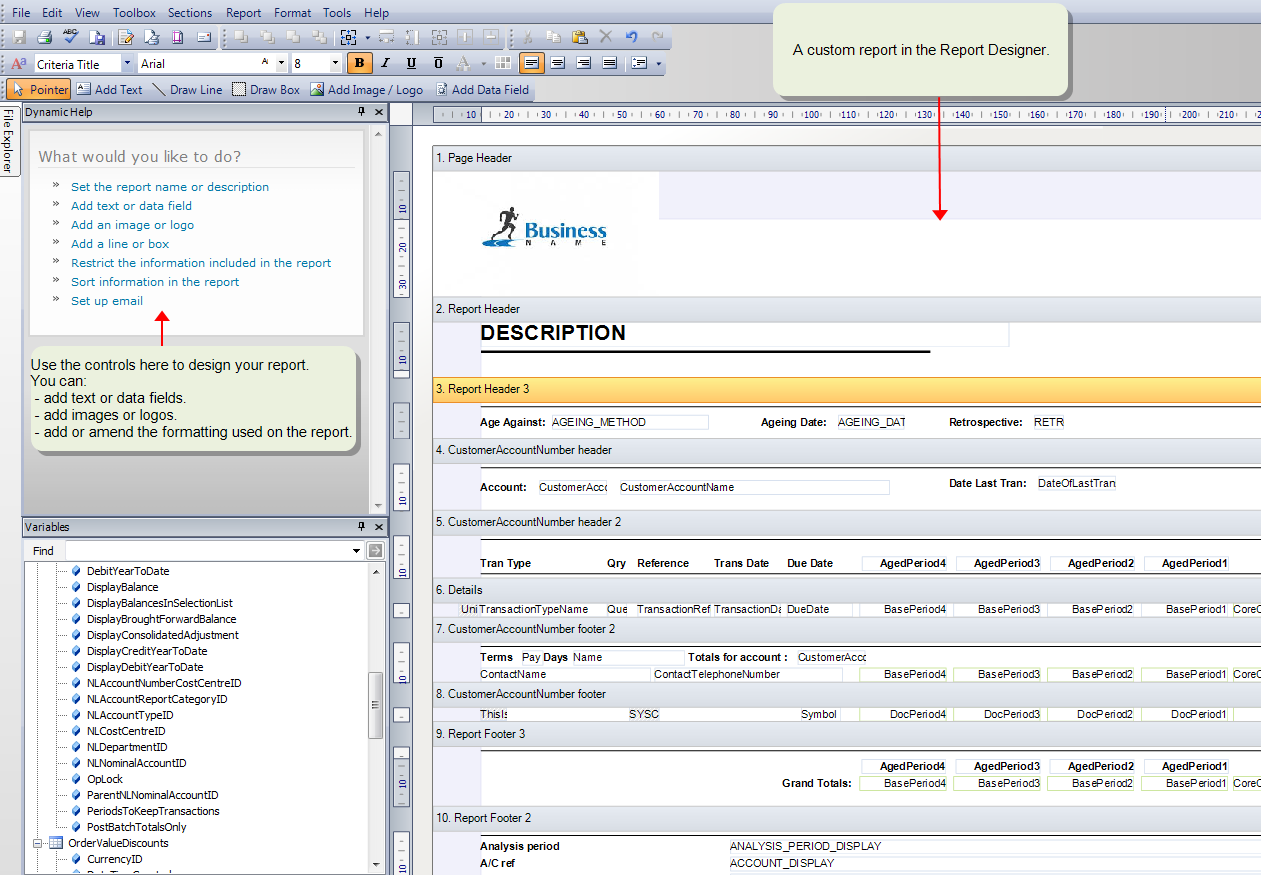
Custom reports
You can also customise any of the reports to suit your own business needs. Using Report Designer, you open an existing report, amend it and then save it as a custom report. Your custom report is then used instead of the standard report when the report is run from Sage 200.
When to design your own reports or documents
Printing reports
You can control how generated reports are output, by setting a Default Output Mode. You can:
- Print then straight way.
- Preview them on screen. There are controls on the preview screen through which you can:
- Save a copy of the report.
- Print a copy of the report.
- e-mail a copy of the report.
- Hold them in a spooler from which you can review, e-mail and print them later.
When reports are useful
- To print documents to send to your customers and suppliers.
- When you require a physical copy of the information to distribute.
When reports are not so useful
-
When you want to add to, or remove, the data included on the report.
- When you want to include information from different areas of Sage 200 or from other sources (such as an Excel spreadsheet).
-
When you want to analyse trends in your data.
Use the Summaries instead. The graphs and charts on the Summary pages give you better analysis tools. They also provide the information in real time, rather than a snapshot at a particular time.
-
When you want to action the information immediately.
Use the Workspaces instead. Workspaces allow you to examine information and then take open the relevant Sage 200 window for the record you're looking at. For example, say you are looking at a list of outstanding customer invoices, you can go straight to the Customer Receipt screen and enter the details of a customer payment.
The enquiry screens help you to interrogate your data and find information about individual accounts and their transactions. Enquiries can be accessed from the Enquiries icon at the top of lists or the Enquiries section from the relevant part of the menu. For example, customer enquiries can be found in Customers > Customer Enquiries.
Enquiry screens enable you to see details of:
- Accounts - customers, suppliers, bank, nominal and stock items.
- Transactions - nominal postings, allocated payments and receipts, VAT, bank accounts, stock history, stock prices and so forth.
- Sales orders - view details of sales orders, returns, quotations and pro formas.
- Purchase orders - view details of orders and returns.
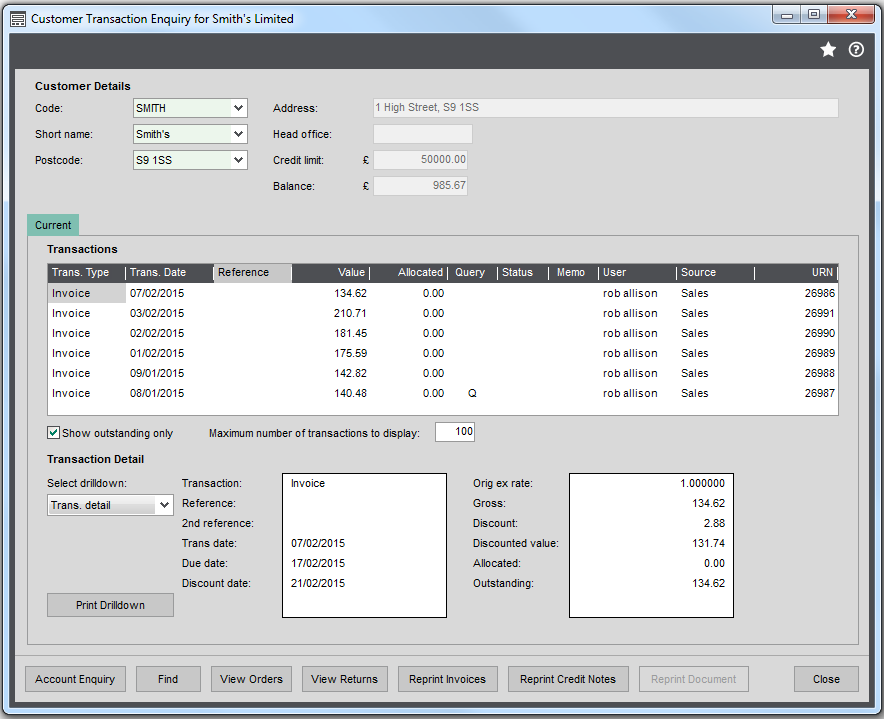
See an example
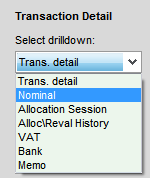
The Customer Transaction Enquiry, shows all the transaction posted to the select customer account. You can drill down and look at a number of different detail views on the transaction information:
When enquiries are useful
- When you want to find information quickly for a specific account or stock item.
- When you want to see details about a specific account or stock item.
For example, use the supplier enquiries to find out how much you owe your suppliers, when you last made a payment to a supplier or the status of individual transactions.
When enquiries are not so useful
- When you want to make enquiries across more than one area of Sage 200 at once. For example, you can't see unposted sales orders or invoices on the customer enquiry screens. To do this you can use the Customer Transaction Workspace.
- When you print information.
- When you want to see details for more than one account at a time. to do this you can use workspaces. For example, to see transactions for more than one customer, use the Customer Transaction Workspace.
- When you want to change the data displayed. To do this you can use the workspaces.
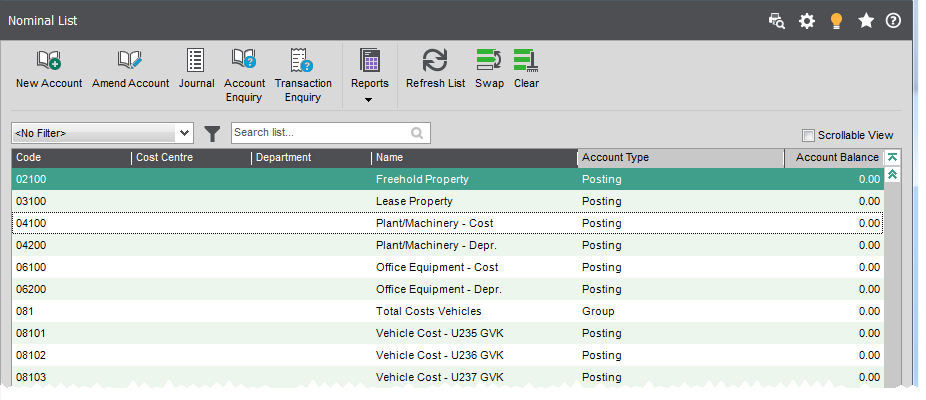
These are a simple way of displaying the information stored for each module. Use lists to find and analyse information, open related windows, perform actions on the items, and generate reports.
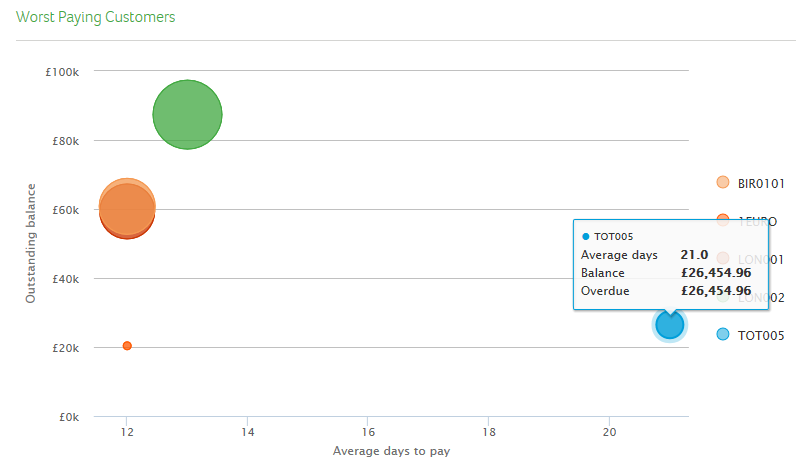
Summaries provide you with a visual overview of areas of the business to help you assess your business performance quickly.
You can select summaries from the Summaries option in the Navigation Area Menu view, or from within the Workspaces option.
When summaries are useful
- When you want an immediate impression of your business performance.
- When you want a feel for trends and an idea of the direction in which a particular area of your business is heading.
When summaries are not so useful
-
If you want to print out or email the information you are looking at.
There is no print facility on the Summary charts and graphs. Consider using a Workspace (from which you can export data into Excel) or generate a report.
-
If you want to look at some information and take immediate action from it.
When looking for information on which you plan to take immediate action we advise you use a Workspace as you can select a record and perform an action directly from the information you are looking at.
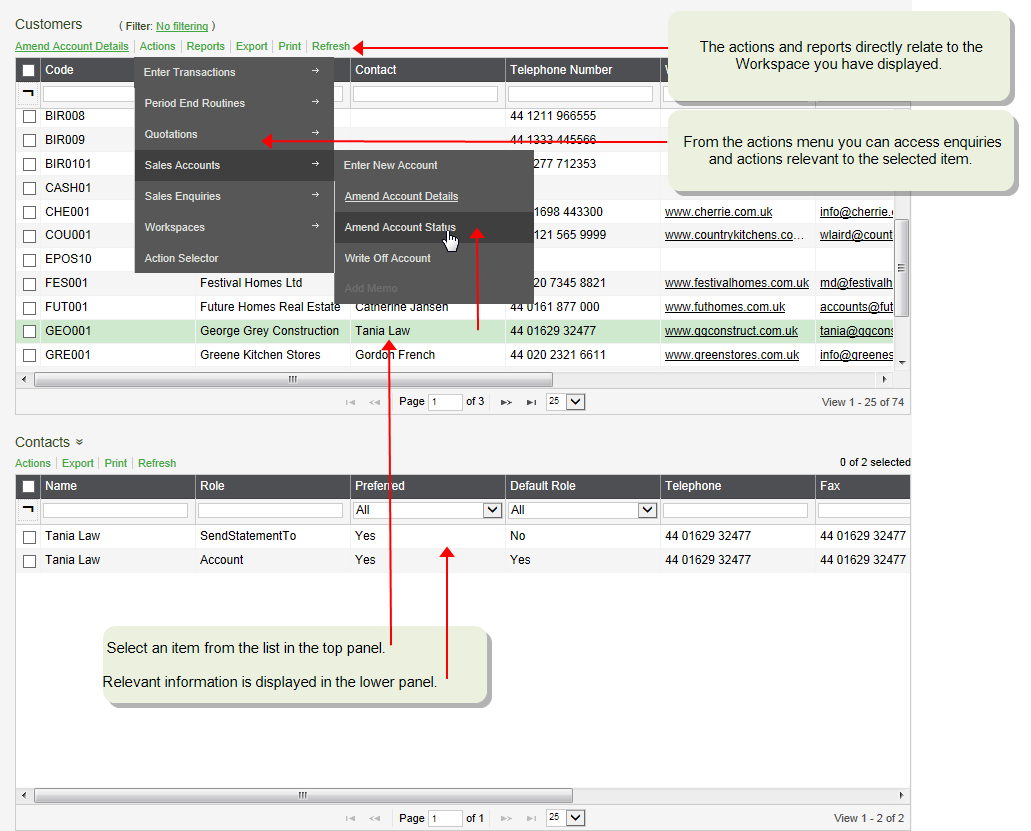
Workspaces provide an alternative to enquiry screens to view and analyse the information stored across Sage 200. You can select workspaces from the Enquires section of the relevant section of the menu or from the Workspaces section.
When workspaces are useful
-
You want an instant view of your Sage 200 data in real time.
The workspaces are updated each time you refresh Sage 200.
-
To view information from different modules or sources in the desktop.
You can add information from any module in Sage 200 to a single workspace.
-
When you want to view information and act on it.
You can open relevant Sage 200 forms from your workspaces.
- When you want to bring all related information together to perform a task.
You can use a single workspace to view information that would normally require you to open several Sage 200 windows or reports.
-
When you want to see the details of an item without opening other forms or reports.
You can select an item on one panel and view information about it on another.
For example, on the Credit Control workspace, you can select a customer on one panel and see all unpaid invoices for that customer on another panel.
-
When you want to change how information is displayed to you.
You can add, remove and move the displayed columns and add filters to your workspaces.
When workspaces are not so useful
-
If you want a printed copy of the information.
Although you can export to Excel the information displayed to you on a Workspace, standard and custom reports are formatted and so present information in a more accessible way.
-
If you want to analyse trends in your data.
Workspaces provide an immediate snapshot of areas of your business. Summaries provide a much better view of trends and can help you to spot anomalies.
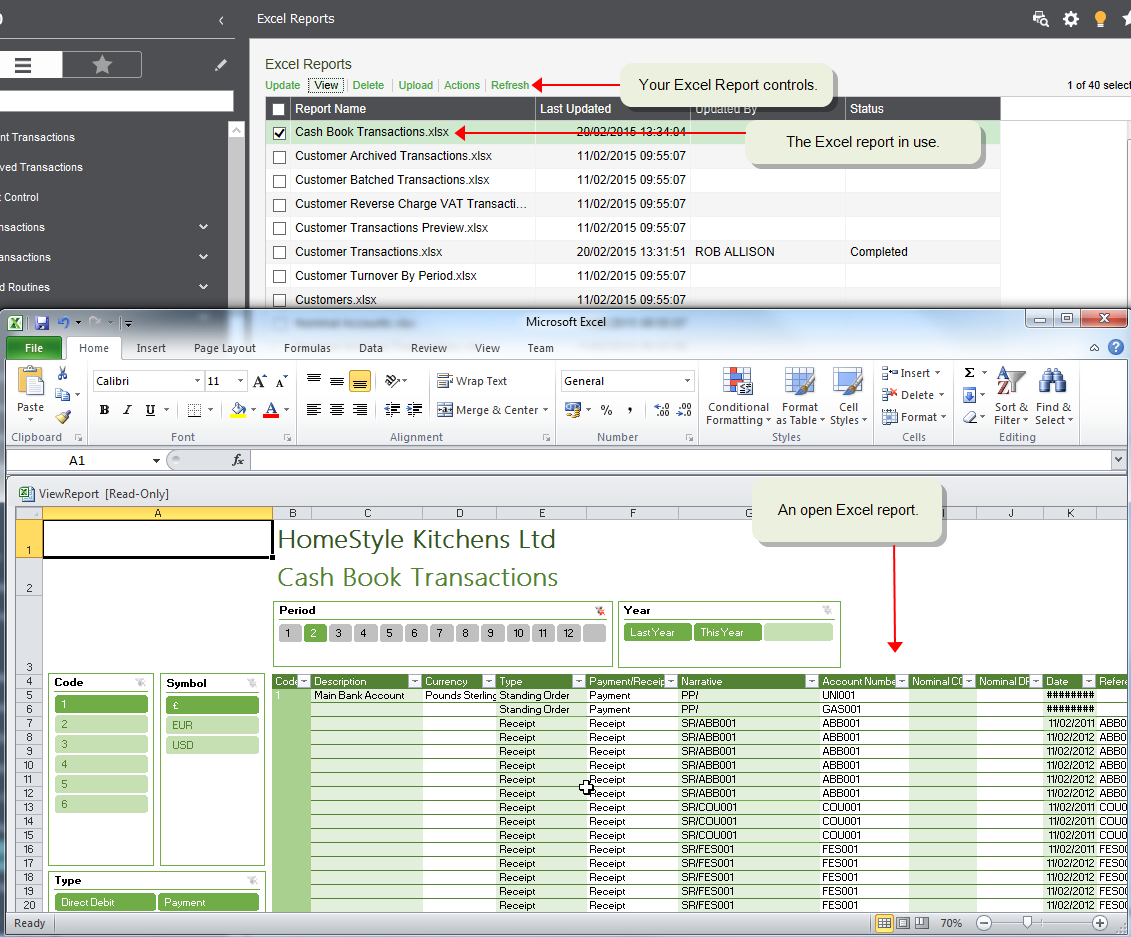
Excel reports enable you to extract, view and analyse information from your system. The Excel reports are loaded into Sage 200. We have provided a number of Excel reports with Sage 200 and others are available to buy.