Design layouts for Financial Statements (Report Designer)
This topic describes financial statements for Report Designer. If you want to produce financial statements for Excel Reporting, see Design layouts for financial data workbooks (Excel Reporting).
Financial statement layouts are designed to provide a clear representation of your accounts.
Several layouts are provided with Sage 200 to produce Profit and Loss and Balance Sheet reports with Report Designer.
If your installation is new, the layouts will be blank and you must use the Financial Statement Layouts option to design the layouts. If you have upgraded Sage 200, layouts are suggested based on the existing category codes in your system.
If you want to project cash flow for up to five years in advance, based on your Sage 200 budgets, you can design a layout for a Cash Flow report, using the Cash Flow option within Financial Statement Layouts.
You use the Financial Statement Layouts option to maintain financial layouts and the Report Designer to create, check and amend layouts.
Using Report Designer
You can add attributes to reports, such as bold and underlining, or additional column heading elements.
Note: If you want to amend a Sage 200 standard report, copy it first, and then amend the copied version. You must then add the report to a menu.
For more information on using Report Designer, see the Sage Report Designer help.
To open Report Designer help:
Open: File > New > Report.
- Press F1.
If you include memorandum accounts in any layouts that you create, keep these separate to the main body of the report. Place them at the end of the report, after the totals.
Balance Sheet and Profit and Loss reports are designed by placing columns and rows on a layout to portray the accounts in a particular sequence. If you are designing a Cash Flow report layout you can only place rows not columns. You can preview and check the results for the Balance Sheet and Profit and Loss reports.
Using columns
Note: Columns are used in Balance Sheet and Profit and Loss layouts.
Sage 200 financial statement layouts have predefined columns. For example, the report titled Profit and Loss MTD-YTD uses the column headings total this month and total this year to date.
You can modify the layout in the following ways:
- Use single columns to display debits and credits together.
- Use split columns to display debits and credits separately.
Using rows
Note: Rows are used in Balance Sheet, Profit and Loss and Cash Flow layouts.
The body of the report, consists of rows, containing the nominal accounts needed to make up the report and defining their position in the report.
You can modify the layout in the following ways:
- Add headings and descriptions in the report body.
- Group accounts that contribute to your financial position.
- Specify category codes to accumulate account balances.
- Specify totals and subtotals.
- Express values as percentages.
Using rows and lines in layouts
There are several line types you can use:
-
Text.
Use text lines, together with heading styles to:
- Specify a title heading to summarise a section of the layout. This is illustrated in Example: using subtotals in your Balance Sheet layout. Text lines are used for headings: Fixed and Long Term Assets, Current Assets and Long Term Liabilities and Current Liabilities.
- Add blank lines to the report. This can improve the readability of the report.
- Apply an underscore in the report.
-
Subtotal.
Use subtotals to:
- Show the balance of a group of nominal accounts.
- Calculate totals in a report, such as gross profit or net assets/liabilities.
You can add a title caption to identify the subtotal, if required.
-
Use this line type to apply values from nominal accounts to the financial statements.
The value can represent one or several nominal accounts. It depends on how you assign category codes in the layouts. Nominal accounts with the same category code are accumulated into one total and included in your report.
You can add a title caption to identify the account grouping.
Note: To use the cash flow report, group budgets should not be used for any income and expenditure nominal accounts to be reported on.
-
Current period profit.
Use this line type to specify the net profit/loss for the period in the Balance Sheet layout.
The category code defaults to an asterisk (*). This accumulates a balance from all the Profit and Loss accounts. When printed, this represents the profit/loss for the period.
Using category codes in layouts
The following examples show how category codes can be used in financial layouts to group nominal accounts.
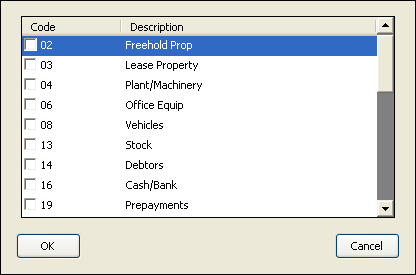
Example 1: using a single category code
This example uses three separate nominal account codes. All are assigned the same category code.
| Account reference | Nominal account code description | Category code |
|---|---|---|
|
25100 |
Purchase Ledger control |
25 |
|
25200 |
Sundry creditors |
25 |
|
25300 |
Purchase Ledger retentions |
25 |
|
If you specify category 25 on one line of your Balance Sheet layout, it will group together all balances belonging to that category and print them as one balance. |
||
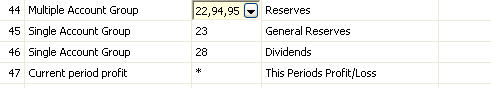
Example 2: using a range of category codes
To show balances for nominal accounts as one total, select the Multiple Account Group Type. This lets you select a number of category codes you want to group balances for.
For example, category codes 22, 94 and 95 are selected for the Reserves section of the Balance Sheet report.
Using heading styles in layouts
Use heading styles to introduce different styles of print to each of your text line titles. You can assign up to nine (1-9) heading styles to text lines.
Use heading styles, for example, to change font size, embolden or underline text. This is illustrated in Example: using subtotals in your Balance Sheet layout. A bold heading style is applied to Fixed and Long Term Assets.
The heading style is derived from the layout file in Report Designer. If you need to establish the format for each heading, use the Report Designer. For more information, see the Sage Report Designer help.
Using subtotals in layouts
Use subtotals to group the balance of nominal accounts together. You can calculate report totals, such as total fixed assets, total liabilities and the cost of sales and net profit.
You can use a subtotal level that can be any number ranging between 1-9.
Subtotals are calculations; they do not use category codes and are not associated with a nominal account. You apply subtotals to your layouts using account group lines.
Example: using subtotals in your Balance Sheet layout
This example shows how subtotals can be used in Balance Sheet layouts. It also shows a bold heading style applied to the title, Fixed and Long Term Assets.
|
Fixed and Long Term Assets |
|||
|
Freehold Property |
105,000 |
||
|
Long Lease Property |
142,000 |
||
|
Plant and Machinery |
88,000 |
||
|
Fixtures and Fittings |
238,000 |
||
|
Total Fixed Assets |
573,000 |
(subtotal level 1) |
|
|
Subtotal level 1 adds all preceding asset figures. |
|||
|
To accumulate the current assets, use the same subtotal level. |
|||
|
Current Assets |
|||
|
Stock and Work in Progress |
46,000 |
||
|
Bank Account |
62,500 |
||
|
Debtors |
32,000 |
||
|
Prepayments |
115,500 |
||
|
Total Current Assets |
256,000 |
(subtotal level 1) |
|
|
If a higher number is used, it would include the value for Total of Fixed Assets. |
|||
|
To add the two subtotal lines, use the next highest subtotal number. |
|||
|
Total Assets |
829,000 |
(subtotal level 2) |
|
|
Long Term Liabilities |
||||
|
Mortgages |
(20,000) |
|||
|
HP Agreement |
(4,000) |
|||
|
Total Long Term Liabilities |
(24,000) |
(subtotal level 1) |
||
|
To accumulate the Long Term Liability figures, use subtotal 1. |
||||
|
To accumulate the Current Liabilities, use the same subtotal level. |
||||
|
Current Liabilities |
||||
|
Creditors |
(18,000) |
|||
|
Accruals |
(5,000) |
|||
|
Dividends |
(2,500) |
|||
|
Employment Liability |
(3,750) |
|||
|
Total Current Liabilities |
(29,250) |
(subtotal level 1) |
||
|
To add the two subtotal lines, use the next highest subtotal number. |
||||
|
Total Liabilities |
(53,250) |
(subtotal level 2) |
||
|
To achieve an overall total, use the next highest subtotal number. |
||||
|
Total Assets Less Liabilities |
775,750 |
(subtotal level 3) |
||
Example: using subtotals in your Profit and Loss layout
|
Sales |
|||||
|
UK Sales |
760,000 |
||||
|
Export Sales |
550,000 |
||||
|
Total Sales |
1,310,000 |
(subtotal level 1) |
|||
|
To accumulate the Sales Figures, use subtotal 1. To accumulate the Trading Expenses, use the same subtotal level. |
|||||
|
Trading Expenses |
|||||
|
Cost of Sales |
(220,000) |
||||
|
Direct Labour |
(150,000) |
||||
|
Total Trading Expenses |
(370,000) |
(subtotal level 1) |
|||
|
If a higher number is used, it would include the value for Total Sales. To add the two subtotal lines, use the next highest subtotal number. |
|||||
|
Gross Profit |
940,000 |
(subtotal level 2) |
|||
|
Overheads |
|||||
|
Rates, Rent |
5,000 |
||||
|
Salaries |
75,000 |
||||
|
Manufacturing Overhead |
700 |
||||
|
Vehicles |
5,000 |
||||
|
Travel |
2,000 |
||||
|
Carriage Inwards |
550 |
||||
|
Power |
3,500 |
||||
|
Office Expenses |
6,000 |
||||
|
Total Overheads |
97,750 |
(subtotal level 1) |
|||
|
If a higher number is used, it would include the value for Total Trading Expenses. To arrive at the total Net Profit figure, use the next highest subtotal number. |
|||||
|
Net Profit |
842,250 |
(subtotal level 3) |
|||
Applying percentages in layouts
Use the Base column to apply percentages to your layouts.
You can express actual values as a percentage based on one subtotal in the layout.
For example, to express all values in the Balance Sheet as a percentage of total assets, set the Base column for total assets to Yes in the layout.
To use percentage base columns in your layouts, you need to do the following:
- Specify at least one percentage column in Report Designer, for example, total this year to date as a percentage.
- Specify one subtotal in your layout as percentage base, for example, total assets.
Example: using base in a balance sheet layout
Total Assets is set to Yes in the base column. This means all actual values will be expressed as a percentage of the Total Assets value in the final printed report.
Adding profit/loss to the balance sheet layout
To show net profit/loss in the Balance Sheet, you must specify the type current period profit. The category code automatically defaults to an * (asterisk), which represents the value for profit or loss calculated from your Profit and Loss nominal codes.
Checking the layout results
Note: Checking results by validating and previewing the report applies to Balance Sheet and Profit and Loss layouts.
Validating the layout
When you have prepared the layout, check the category codes are valid, linked to a nominal account and appear only once in the layout.
- You can do this by selecting Validate.
Messages are displayed by the routine to warn you if anomalies are found.
Reviewing the layout
- You can view the format of the report by selecting Preview.
- You can print the layout from the Report Layout Details window.
Printing the report
The final report combines what is outlined in the columns and rows with the nominal account balances, to produce the final statement.
Open: Reports > Financial Statements > [your report layout].
-
Check the Balance Sheet financial statement balances.
If the Trial Balance report balances, but the Balance Sheet does not, then the problem is caused by the design of the layout. Ensure all appropriate accounts are included in the Balance Sheet layout.
-
Check the net profit on your Balance Sheet agrees with the net profit on your Profit and Loss financial statement.
If these do not agree, then the problem is caused by the design of the Profit and Loss layout. Ensure all appropriate accounts are included in the Profit and Loss layout.
For more information on printing reports, see Nominal Reports.
When you have printed the Balance Sheet and Profit and Loss reports:
Import or export a layout
If you want to share layouts between companies, you can import and export layouts. This saves the layout as a CSV file, so you can edit it using Excel.
Note: You can import and layouts for your Profit and Loss and Balance Sheet, but not Cash Flow layouts.
Open: Nominal Ledger > Utilities > Ledger Set Up > Financial Statement Layouts.
- Choose the layout.
- Click Import or Export.
- Choose the filename and location of the layout.
Steps in this task
Maintain balance sheet and profit and loss layouts
Maintain cash flow report layouts
Other tasks
Overview